• Skip to main content
  • Skip to footer

Agricompas

Agricultural Data Analytics: Knowledge and decision support

  • Home
  • About Us
  • Team
  • EcoProMIS
  • Blog
  • Contact

EcoProMIS

Innovation, growth and data analytics

17-Nov-2020 by agricompas

By Nicolás González, Business Development Manager

The world is changing. Every day we see how new technologies are being developed and many of us may have come to dread the idea of being displaced by a machine. But that is not the way of things. Technology is meant to make our lives easier, and we believe that the coexistence between traditional methods and newly developed ones is possible, if not meant to be.

In recent years, agricultural data analytics has become one of the top edge tendencies in terms of sustainable development globally. This means that there is a lot of research and a lot of projects currently trying to understand agricultural dynamics and how to use information in order to optimize processes and achieve sustainable objectives.

Although this is a very beautiful statement, the reality growers are facing on a daily basis, and how this information is to be gathered, processed and used, represents a huge challenge not only for farmers but for the whole agricultural value-chain.

Agricompas drones collect images of farms for innovative data analysis

Agriculture in LMIC countries still relies on manual labor. The culture of innovation, technology, insurance, good financial practices and data analytics is still in a juvenile stage.

Nevertheless, governments and private capital are incentivizing fast growth through technology and new services are becoming more common every day.

Innovation and Market Growth

For us as an agro data analytics company, innovation is the only way to break through such barriers and use our knowledge to evolve the growing market. This is our main drive, our oxygen and our compass. As Harvard Business Review’s article: Breaking down the barriers to innovation states:

To us, innovation doesn’t mean mere inventiveness. In our work we define it as: something different that creates value.

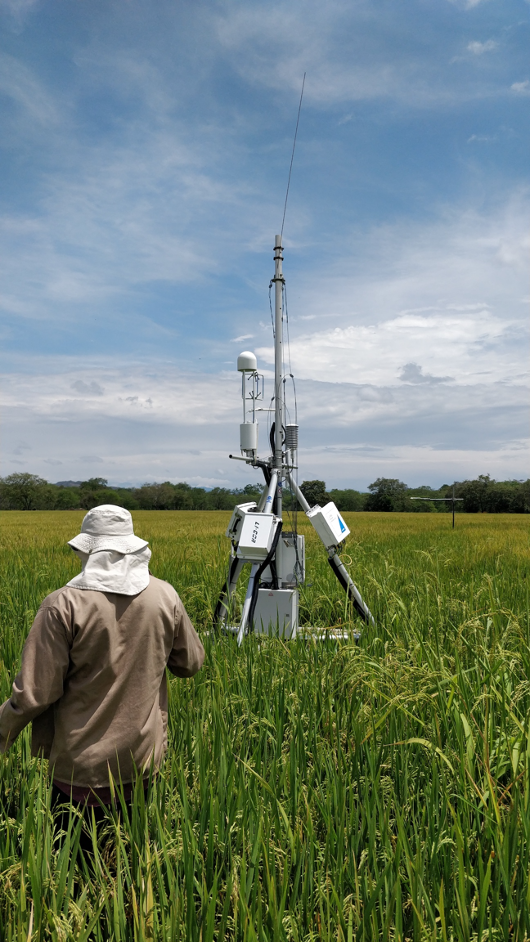
As we work with agricultural big-data, we face the challenge of gathering, processing and delivering useful information in the context of market needs and opportunities. By doing this, we look to make our EcoProMIS platform a value generator for growers, governments, and financial and insurance institutions.

Analytics for Decision Support

In order to capture what really drives the agricultural market in terms of financial services, risk management and productivity optimization, our innovation process aims to understand the market and develop tailored solutions that make the decision-making process more efficient, thus giving business intelligence the recognition and merit it deserves for the immense toolkit it provides us with.

We believe that by bringing sustainable agriculture into the digital era, better conditions for growers may be achieved. We believe that when real value is generated it can also be garnered.

We believe that corporate institutions can see a benefit as well, using high quality information and business intelligence, improving their margins, creating new delivery methods, enhancing R&D and, finally, increasing sales.

Our EcoProMIS platform sends farmers notifications using a suite of apps

With the richness of precise, accurate and relevant information, we enable an increase to the market size of agro insurance and provide the much-needed agronomic crop management data necessary for a new and creative product development ecosystem.

The world is changing. And so are we. Breaking through the barriers of convention, we have come to innovate and leave the world in better shape than how we found it. We believe that a new era for sustainable agriculture and analytics has come at last.

Connecting growers with an essential service in the modern world

30-Oct-2020 by agricompas

By Richard Strange, Head of Engineering at Agricompas

As individuals we all grow in wisdom and capability when we take time to reflect on our actions and find lessons to apply to tomorrow’s challenges. We look at our achievements and the memories that are anchored around them. We use them to guide us in becoming better in both our professional and personal lives. Modern business is very much the same. In the modern world, when a business moves, the byproduct of their actions is data.

Agricultural Data Gap

Whether it is a financial officer’s log of transactions, the record of work hours from an employee’s timesheet, or the number of clicks a website receives each day. It is rare to find a part of a business that isn’t measured or collected, either directly or by proxy through other measures. Yet in agriculture, little information is available around many crucial farming practices that often mean the difference between a bumper crop or financial devastation for families and communities.

It is not enough to say that you have an employee, or a website, or an invoice. The crucial questions are if the employee is doing their work, if the website is drawing attention, if the invoice is correct. Yet farmers are not able to answer critical questions about their own farms. They have sown their seeds, yet cannot say how many are germinating. They apply fertiliser, yet cannot tell if it is cost-effective. By leaving agriculture behind in this wave of data-driven business, the world is abandoning millions of farmers in data poverty, and powerless to compete against their wealthier first-world counterparts.

EcoProMIS Collects Quality Data

In leading the EcoProMIS project, the aim of Agricompas is to make a difference by empowering farmers with the knowledge they need, from sensor to survey to satellite to weather to drone data. But with each additional source of data, the difficulty of pulling them together increases exponentially. I’m the Head of Engineering at Agricompas, and I’m responsible for all the data EcoProMIS gathers. My job is to work out how we pull all this information together, understand it and then provide the information to those that need it.

There are two approaches to tackling a challenge like ours. Firstly, you can manually handle the data, with a team of analysts pushing round files via email, shared folders and collaborative spreadsheets. This does come with the advantage of immediate productivity and visibility. But there’s little certainty over the quality and completeness of data, and no way to be sure what information is where. The second option is to invest time and effort into a fully-fledged platform for data. It must allow the scientists we work with and the farmers that we support to put in and take out the information they need effortlessly.

Advanced Data Platform Prevents Errors

Only recently, the failure of the first, manual approach was highlighted by the loss of the records of 16,000 positive COVID-19 cases by the UK government. Was it a catastrophic server failure? the act of a malicious hacker? The truth was far more mundane. An analyst had opened the spreadsheet holding the list of COVID-19 cases in an old version of Excel, slicing 16,000 rows of data off without ever realising their mistake. Suppose this approach cannot work reliably in the hands of a team as well-staffed as the Public Health England team. How can we trust our own information in a similar system? We owe our growers and our own team better than that.

The cost of getting your data platform wrong (https://www.bbc.co.uk/news/uk-54412581)

Over the last six months, the EcoProMIS team has been carefully creating a central platform that can look after farmer data responsibly and safely. A system of databases, redundant servers and security measures means that data doesn’t get forgotten, doesn’t get destroyed and doesn’t get leaked. Over the coming months, we are combining our suite of analytics, models and AI with new apps.

These apps will allow farmers to provide and see their data about their farms and help them make the right agricultural decisions. We already have the first app in early tests, with a knowledge presentation app in the works for release by the new year.

Connected Growers

As we evolve our platform and grower apps through close feedback with early users, we will be able to put more power back into the hands of growers, irrespective of their literacy or agricultural experience.

Agricompas and the EcoProMIS project exist to level the playing field and make agriculture fairer for farmers in the most challenging economic, environmental and social settings. I am incredibly proud of what our technical team has achieved to make that happen.

Data Analytics Make Sense

13-Oct-2020 by agricompas

By Simon Dzurjak, Data Analyst at Agricompas

With the advent of the big data era, the way we gather insights about processes affecting our everyday lives has changed dramatically, and the domain of agriculture and food production is no different.

As a result of the widespread availability of various sensors, from satellites and UAVs, to climate and soil measurement hardware on farms, we can now gather data at unparalleled rates and volumes. However, in its raw state, the data we collect often provides little, if any, insight. These raw measurements need to be processed and analysed through complex pipelines to be turned into a valuable product.

The engine responsible for driving the change of raw data into worthwhile insights is data analytics.

Data Analysis for EcoProMIS

Since joining Agricompas in July, I have been working on ensuring that the EcoProMIS data which is stored and arrives on our cloud platform, is as high quality as possible. Analytics and predictions are only ever as good as the data from which they are sourced, hence rigorous checking of data quality is always a necessary layer in data intensive projects. To help with this, I wrote a number of programs generating data quality statistics, which will ensure that any analytics we produce will be reliable and trustworthy.

The statistics produced by these scripts are then visualised and fed into internal dashboards, which provide a quick and intuitive way of keeping an eye on our data and making sure that it looks the way we expect it to.

Data analysis is an essential part of our work on the EcoProMIS project.

Eddy Covariance Data

So far, one of my most enjoyable (but challenging) experiences was working with large eddy covariance tower datasets. Eddy covariance towers are brilliant at logging and producing rich atmospheric chemistry flux datasets allowing us to understand the minute gas exchange processes in agricultural fields. This data is important for our crop modellers, allowing them to produce various models capable of predicting crop phenology and yields.

However, due to the way that the hardware transmits the data, it is common for gaps in data to form (e.g. as a result of signal loss). Luckily, with the power of statistics, we can accurately discern the missing values and fill the gaps in the data. Working closely with the crop modelling team, after many discussions and much research, we have successfully automated this process, and allowed ourselves to further iterate and improve on it if need be in the future.

Integrating Diverse Data

As for the future, I also look to my past and hope to bring some of my previous experience in working with remote sensing and Earth observation data into our platform. Integrating and tying all the data types together will be a big challenge, however I am certain that it will bear fruit and truly create a platform which will make farming easier, more precise and more sustainable.

With advances in computational power and the high quality data available to us, I believe that data analytics and artificial intelligence will play a key role in revolutionising agriculture, and it is rewarding to be a part of a team making this happen. Combining multiple sources of data together into a single product will allow us to create a platform capable of supporting decisions via accurate insights and improving the ease with which farmers grow crops like never before.

Why the eddy covariance technique is an ally in the search of sustainable agriculture

28-Aug-2020 by agricompas

By Agricompas Crop Model Team

In recent decades, agriculture has been under the scrutiny of society and the scientific community due to the negative impact that it generates on the environment. These impacts are of many types, including deforestation, eutrophication of water bodies, the reduction of biodiversity due to the intense use of pesticides, and the emission of greenhouse gases (GHG).

In relation to GHG emissions, these are released in the process of manufacturing inputs, such as, fertilizers. Also included are the GHGs released as a result of the transport process: first of inputs towards the production areas, and then of the product towards the consumption areas.

An eddy covariance system recording greenhouse gases emissions on a commercial rice field at Colombia for EcoProMIS project. (Agricompas)

A Complicated Task

But the most complicated task from a methodological point of view is to determine the GHGs that are released during the production stage. Among the GHGs released to the atmosphere during the production phase, the most important are carbon dioxide, methane (in systems where the soil is in anaerobic conditions), nitrous oxide, and ammonia.

Methodological difficulties are associated with the fact that these emissions are determined by dynamic factors such as climate, soil characteristics, and management practices, especially fertilization and irrigation.

Since it is impossible to survive without agriculture, efforts have focused on developing and implementing production systems able to maximize yields while reducing negative effects on the environment. A prerequisite for advancing in this direction is to measure the GHGs generated during agricultural production cycles.

Static Chambers

To understand better the methodological challenges involved in determining these gases under field conditions, let us take methane as an example. This gas is generated as a product of the decomposition of organic matter in the soil under non-oxygen conditions, typical of crops such as flooded rice.

Traditionally, static dark chambers have been used to collect samples that are later analysed by the gas chromatography technique in specialized laboratories.

This technique has a high sensitivity to determine low methane fluxes, is easy to handle, and has a low cost. But its main disadvantages are related to the low spatial representativeness and the inability to generate data at different time scales.

In other words, the measurements only represent the gas flux in a small area and at a specific time point, which leads to the question: can this technique generate data to represent what happens in inherently heterogeneous and dynamic agricultural systems?

Eddy Covariance

It is in this context that the technique of eddy covariance appears, as an alternative way to measure, among other variables, methane flows with greater spatial and temporal representativeness.

This technique employs a complex assembly of sensors arranged in a tower (which is why they are usually called eddy covariance towers) that records variables that ultimately allow the determination of the exchange of gases and energy between the crop and the atmosphere.

Although the foundations of the technique and data processing are complex, it provides useful information in the search for more sustainable agricultural systems.

This is because, in addition to determining GHG emissions, such as methane and carbon dioxide, the eddy covariance technique also provides information about the flow of energy between the soil, the plant, and the atmosphere. This means that information is also useful to improve the water use efficiency since the measurements allow the determination of water fluxes from the crops to the atmosphere (evapotranspiration).

All of this information is comparable in terms of accuracy with data obtained by reference instruments such as lysimeters. Therefore, the technique of eddy covariance is currently a powerful ally in the search for more sustainable agricultural systems.

Use with EcoProMIS

The EcoProMIS project has four eddy covariance towers in Colombia, two recording data on rice crops, and two on oil palm crops. The data collected by these stations are being processed to calibrate crop models that allow, in addition to predicting yields, to estimate GHG emissions.

Together with our partners (CIAT, Cenipalma, Fedearroz, IWCO, Pixalytics and Solidaridad), the final objective of the project is to generate “knowledge and decision support” to orient stakeholders towards sustainability.

Measuring the real impact of EcoProMIS

28-Jul-2020 by sam adams

Editor: In this article, the EcoProMIS Monitoring and Evaluation specialist explains how and why we are measuring the impact of our rice and oil palm project in Colombia. Written by Elizabeth Sweitzer, CIAT.

Often in the realm of research for development there is a tendency to focus on results. Indeed, this is the focus of results-based management (RBM), arguably the leading management methodology for international development. In an effort to uphold accountability and transparency (especially in the face of fiscal austerity), RBM defines clear results and products and demonstrates how interventions achieve those results.

But results are just the beginning. Results tell us what products and services the project provided. In order to tell the full story, we also need consider how these results generate and sustain impact. Impact on the other hand explains the changes in behavior we see as a result of those products and services, and how they contribute to holistic improvements for individuals, communities and landscapes.

Why measure impact?

Simply put: we want to tell the full story.

It’s one thing to report on the number of farmers that participated in EcoProMIS trainings – a result. When we measure or forecast impact, we explain how those farmers used those trainings to improve their productivity and livelihoods. We learn about how knowledge services shared on mobile applications help to improve on-farm management decisions. We can estimate how financial savings amongst farmers help improve gender equity, household nutrition, and education outcome.

And that’s where I come in. I’m Elizabeth Sweitzer, the Monitoring and Evaluation Specialist for EcoProMIS. Known by most as an “M&E Specialist”, my work revolves around assessing performance. I am based at CIAT in Cali, Colombia. I help EcoProMIS measure the progress of interventions, the efficacy of knowledge services we provide to farmers, and more to help tangibly understand results and impact.

My work also helps us understand the nature of results, for example were they positive or negative? Intended or unintended? What was learned in the process, what will we change moving forward? In doing so, I help to understand, forecast or even measure the impact of the project.

How do we measure impact?

During the project, we keep robust monitoring systems verified by a ‘logframe’ (logical framework) to test the attainment of our results. Process evaluations keep track of how we are doing, and provide opportunity to pivot course where needed. Learning questions are defined and keep us on our feet, helping us reflect. We also plan to be able to tell the “happily ever after”, by developing plans to measure the sustained impact of our interventions, how people change over time and what practices they truly adopt and make habit of.

EcoProMIS team conducting interviews with growers

Measuring impact with EcoProMIS

Working alongside a team of researchers, implementers, managers, extension agents and more, we work to find dynamic tools and mechanisms to measure this impact for a number of different stakeholders. As EcoProMIS is made up of a dynamic team of specialists with backgrounds in socio-economic, environmental, business, and management backgrounds, we possess dynamic ways of measuring impact.

Our metrics come from a host of different qualitative and quantitative studies, and are promoted by an idea that iterative monitoring and evaluation is essential throughout the project lifecycle and even after. We look forward to measuring lasting impact and helping farmers develop sustainable, profitable, and productive lifestyles.

Gantt for Good

18-Jun-2020 by sam adams

Sam Adams, Agricompas Head of Programmes

Gantt charts show tasks in a chronological order

At EcoProMIS, we are well aware that our project is both exciting as well as full of demands, requiring careful planning and communication. In my last blog article I explored how we are managing the complexities of a five-year international agri-tech project.

I mentioned in that previous article that to help manage complexity, we have implementing a new cloud-based project management system. Today I share a bit more about that process and how we have introduced ‘Gantt’ to clarify roles and responsibilities, manage expectations, and design a robust and logical workflow.

Cloud to the Rescue
The EcoProMIS team is spread over seven organisations, based in multiple sites in both the UK and Colombia. There is a six hour time difference. Because of these logistical realities, we have chosen to work with cloud-based digital communication and project management.

So, like most of us during this time of global working-from-home, we have been extensively using digital communication tools. How grateful we are that these tools are widely available! It would have been a very different picture just a few years ago.

In practice, this means that for daily communication we use a mobile chat app, the usual email correspondence, and we are slowly getting used to Microsoft Teams (having previously used Slack for years, this is a bit of an adjustment).

Gi-GANTT-ic Support
In addition to these daily conversations and regular team meetings, there is still the need for an advanced system of project management. For a project of our size, this is a gi-GANTT-ic need. So over the past weeks and months, I have been setting up a Gantt chart system for our EcoProMIS project management.

For those who are unfamiliar, a Gantt chart is a way of seeing a project’s lifespan in a single image. It shows all of the tasks in chronological order. Further details can be added, such as who is responsible for each task, and which tasks are dependent on others.

Most projects have a timescale of 3-6 weeks. EcoProMIS however, is a five year initiative, so the scale and detail required in our Gantt is significant. I have certainly enjoyed the challenge of creating it.

Open Source Trial
In order to choose the most appropriate and affordable Gantt software, I tested six different products. Most have the same features and similar pricing, so it was difficult to navigate the options.

Initially I settled on Open Project, an open-source product that can be self-hosted. Having access to our own servers and our own world-class IT team meant this seemed like an easy option, and the open-source values resonate with our vision to make positive change in the world.

Unfortunately, the maintenance for this self-hosted option was excessive and beyond the availability that our team had. I made the reluctant decision to start again and transfer to a paid system hosted in the cloud.

Remote working during the COVID-19 pandemic means new challenges and opportunities.

TeamGantt
Leaving Open Project behind, I settled on a dedicated and affordable product called TeamGantt. It is a responsive and clean-looking Gantt chart, with all the features that we required. In early June I rebuilt the entire project plan from scratch on this new system. This was frustrating but ultimately served to refine the end result, which is now working well.

The EcoProMIS Gantt structure is based on quarterly tasks and milestones. This is because each quarter we deliver tangible outputs and report on these to our funder, the UKSA.

A Dynamic Map
It is an important point to state that the Gantt chart is not a static document that once created is filed away somewhere. Part of the purpose of the chart is that it is alive, a tool or dare I say ‘friend’ of the project. It is used as a dynamic and responsive communication and management resource.

In practice, this looks like using the Gantt chart in a screen-share during our meetings, to communicate expectations around each others’ roles, and to plan timelines and scheduling.

A Gantt chart is also a reference point for everyone in the project to use. At any stage and any time zone, our team can login in to the website and see their own tasks, their colleagues’ tasks, and how the entire five year project fits together.

Likewise, it can serve new arrivals to our team. For example, recently I met with Rodrigo Gil, our new Crop Modeller, to look at the Gantt and show where the project has come from over the past three years. This forms an essential part of new colleague induction.

Effective Project Delivery and Culture Change
All of this work and technicality is ultimately to aid the smooth delivery of a complex multi-faceted project. Our new cloud-based Gantt chart is a great asset to the team, and I believe will improve our ability to reach the demanding goals and cutting-edge targets of EcoProMIS.

The colourful and clean digital interface is appealing and immediately gets attention. The details of the task interdependencies and scheduling of roles and timeframes, means that all partners are better equipped and more accountable in their work.

I also note that by introducing an effective Gantt chart, it can bring an organisational culture-change. Using an accessible Gantt chart contributes to a change in mindset from loose project delivery and inefficiency; to a much tighter project, with greater cost and time efficiencies and hopefully a happier, more connected workforce, better able to deliver our mission to support the Colombian rice and oil palm growers.

  • Go to page 1
  • Go to page 2
  • Go to Next Page »

Footer

AGRICOMPAS, LIMITED

46 Butts Road, Oxford, OX33 1RJ
United Kingdom

Registered in England and Wales. Company number 10493622.

Contact Us

© Copyright 2017 - 2023 Agricompas, all rights reserved. A web creation by LBDesign.

  • Privacy Policy
We use cookies to ensure that we give you the best experience on our website. If you continue to use this site we will assume that you are happy with it.OkPrivacy policy