By Simon Dzurjak, Data Analyst
Satellites orbiting the Earth allow us to gather insights about farms and the crops they are producing at unprecedented spatial and temporal resolutions. This is one of the key features of Agricompas’ approach to digitising agricultural value chains and providing value to the sector.
Remote Sensing and Big Data
Remote sensing and Earth observation have not been left behind in the current big data revolution, with a large and ever-growing number of both open and commercial datasets providing years, sometimes decades, of historical data, ready to explore using big data techniques.
At Agricompas, we are using imagery from satellites such as Sentinel-2 to monitor farms and develop models to predict the crop phenology, health and yields. This is in combination with ground-sourced data such as weather stations and soil tests as part of our EcoProMIS platform.
Processing Satellite Images
Whilst satellite imagery in its raw form is intriguing to look at, it does not tell us enough to be immediately helpful, therefore it must be refined further into various indices and biophysical parameters.
Crops are complex, living, plant organisms which interact with various wavelengths of the electromagnetic (EM) spectrum in a variety of ways. When monitoring crops using satellite imagery, we can use the various reflectance and absorption characteristics of plants in the visible and infra-red portion of the EM spectrum to our advantage and use mathematical methods to derive vegetation indices, each of which highlights a certain property of the crop.
The vegetation index data derived from satellite images can then be correlated with various biophysical parameters of the crops and insights about crop health and potential yields can then be modelled and monitored, giving farmers the insights they need.
Real-time Data for Farmers
Over the last few weeks, a large pipeline to mine valuable data from satellite images has been under development at Agricompas. The products derived by this pipeline will soon be used in machine learning models and crop modelling to develop accurate predictive models.
We are now in the final stages of putting finishing touches on the pipeline and testing it, ensuring that everything runs smoothly. Soon, the pipeline will be deployed to our cloud environment, where it will run automatically, and continually process the satellite images.
This will allow us to process an image as soon as it becomes available to us, letting us always have up to date and quick results about the farms we are monitoring.
Additionally, we are making sure that the latest imagery of the farms we are monitoring is available to the farmers via our knowledge services application.
We are extracting individual farm data from the large satellite images, so that the farmers can visualise the farms they are interested in, and do not have to manually locate their farm in the satellite image scene.
Practical Application
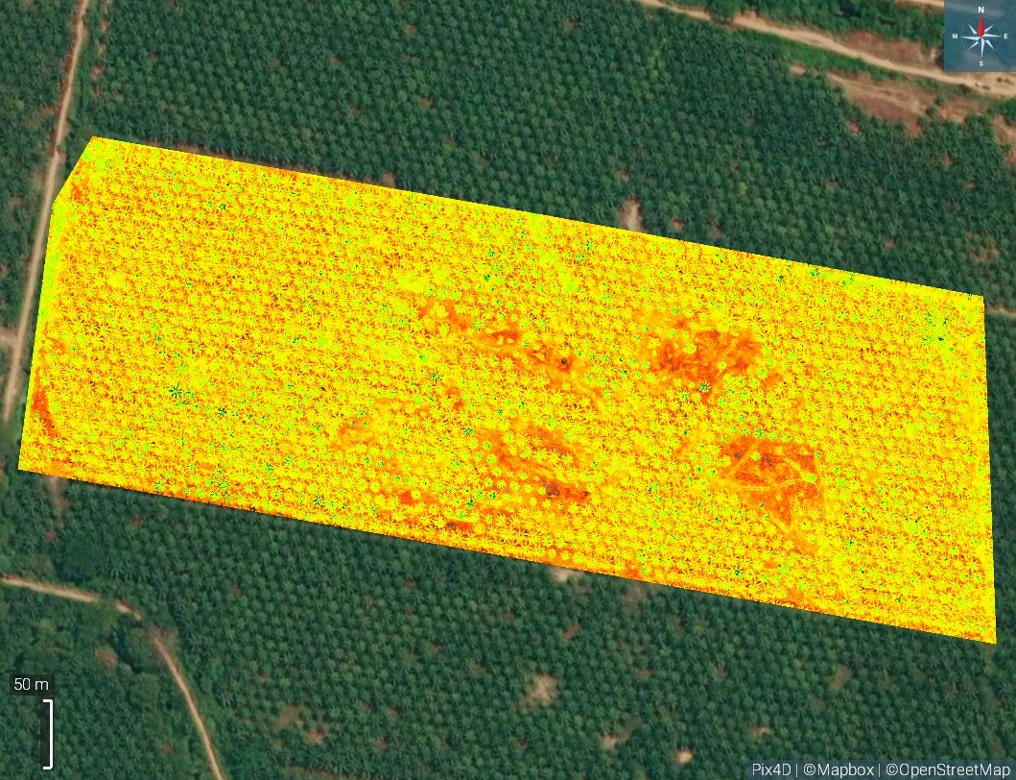
Farmers and other users will be able to visualise both true-colour imagery, as well as derived indices such as NDVI, giving a bird’s eye view of farms, highlighting issues such as unhealthy crops and allowing for quick responses before these issues turn into problems.
Automating the mining of the satellite imagery for valuable data has been a very exciting project to work on and brings a lot of additional value to the EcoProMIS platform. We are continuing to make sure that all of the data we work with is accurate, with advanced models producing reliable results, and supporting our users in undertaking the best decisions.